Buck Gardner PowerBI Dashboard Case Study
The Challenge
Buckgardner Inc is having volumes of data sitting in the Odoo ERP and the customer is interested in bringing out meaningful insights from the data. They want a Sales cum Budget dashboard which can be shared with intended parties across the organization with the ability to automatically refresh itself in a periodic manner without the need for manual intervention.
The Solution
Our Odoo Power BI direct connector acts as a direct bridge between Odoo and Power BI (Link). In our advanced module scheduled refresh has been made possible. To start with, integration of Odoo data and historical data from excel sheets was done using Power BI.
This dashboard got multiple views, a single-page visualization with multiple charts and graphs and live stats. We used Account.move.line, crossover.budget, crossover.budget.lines, sale.order, sale.order.line & many other major tables that have over 3 million records. This can fetch up to 2-3 million records and proceeds with real-time calculations, that also refresh automatically in less than 10-15 minutes (Can vary from different to different databases).
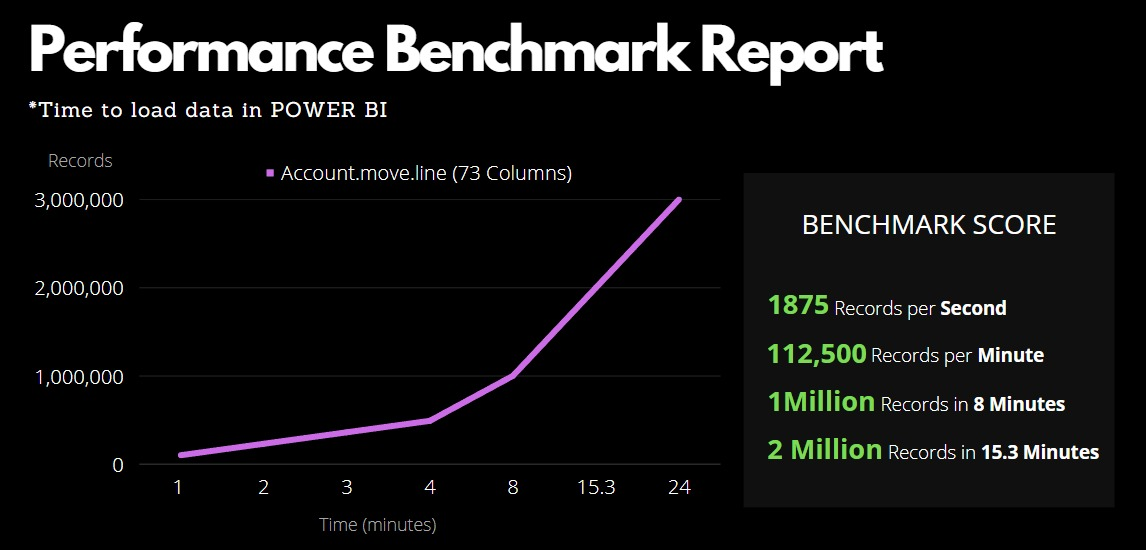
Designed in such a manner that it takes a few seconds to load and milliseconds to respond. Every formula is implemented precisely and efficiently to provide numbers accurately and fast.
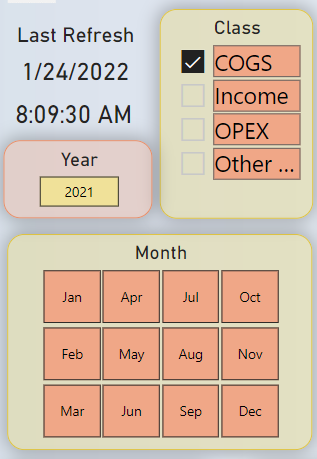
We have implemented a lot of slicers and cards which work universally. Their relationships work flawlessly — for instance, class Income reflects with respect to sale orders and product table.
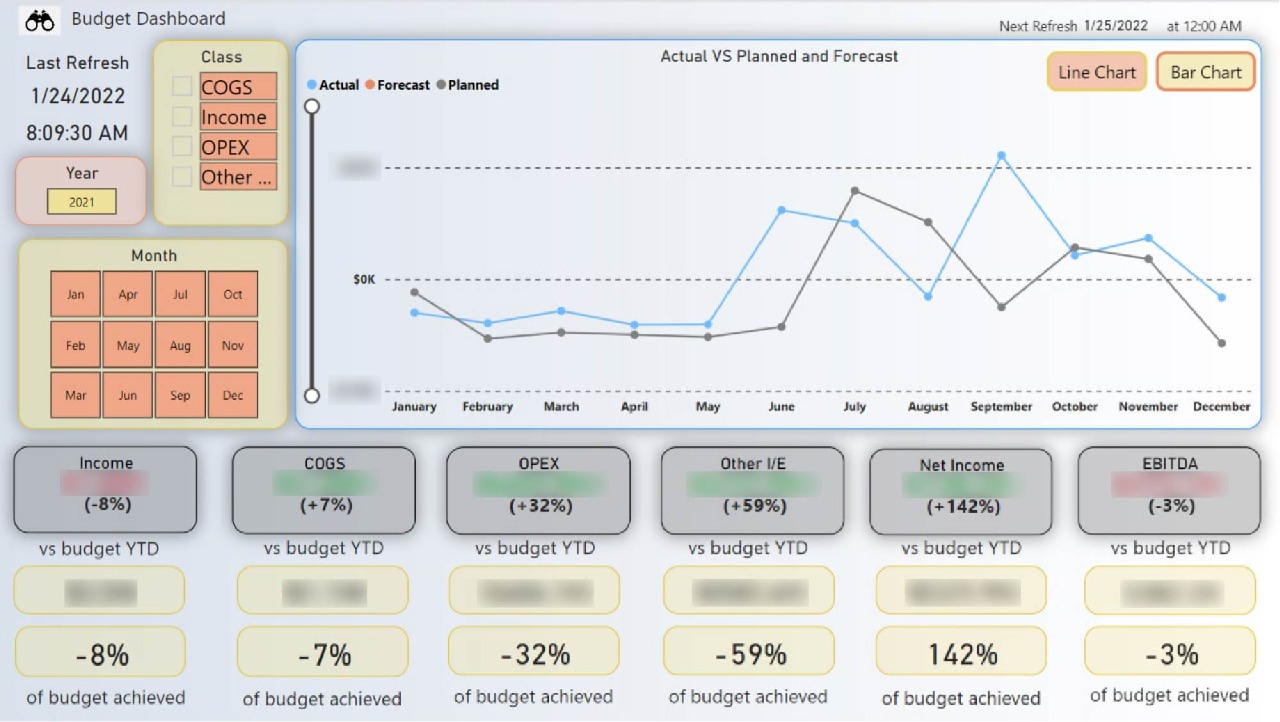
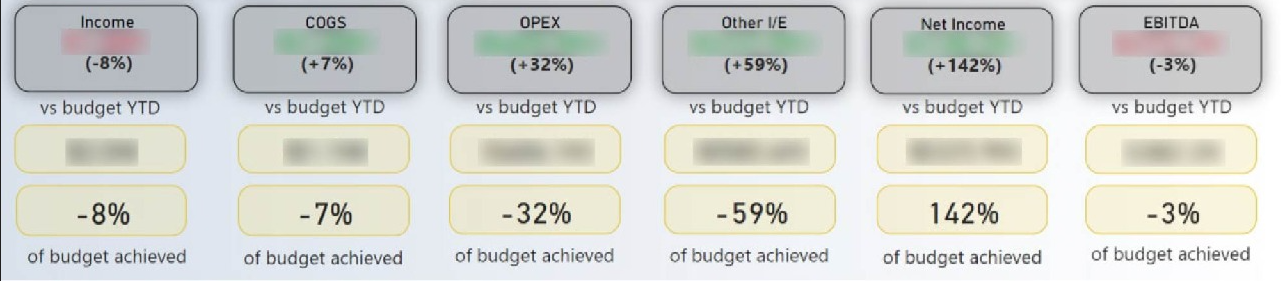
Multiple views right on the screen like Income, COGS, OPEX, Other I/E, Net Income & EBITDA. The views can be altered according to the months and years. Primarily 4 classes are given to get focused study.
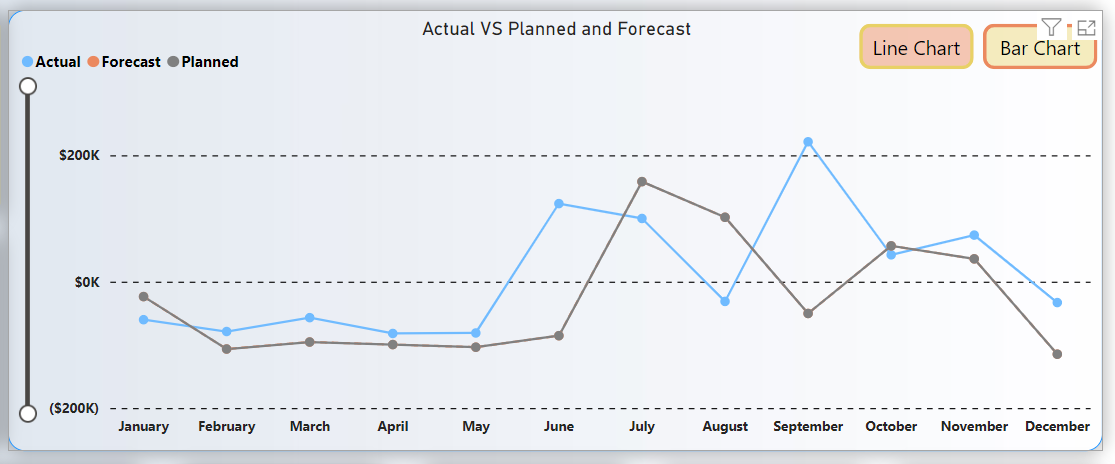
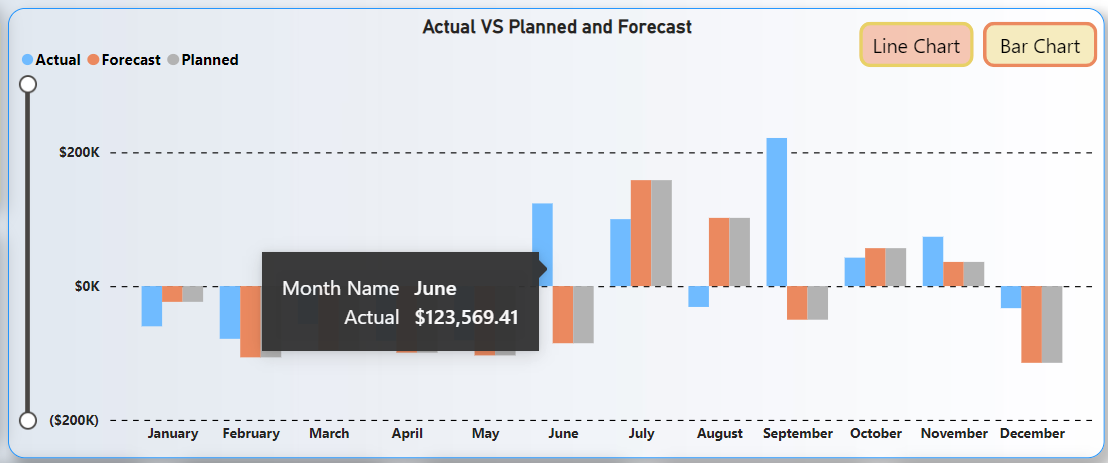
Visual Panel shows both Line or Bar Chart plotted concerning Actual vs Planned and Forecast. You can highlight any node & also reflect it in the data presented below.
-
COGS:
Cost of Goods Sold (COGS) also known as "Cost of Sales" is the cost of acquiring or manufacturing the products that a company sells during a period.
-
EBITDA:
This stands for Earning Before Interest Tax, Depreciation and Amortization. As the name suggests it is a measure of a company's overall financial performance and is used as an alternative to the net income in some circumstances.
-
Net Income:
Net Income is the amount of Accounting profit a company has left over after paying all its expenses.
-
Opex:
Any Operating Expenses that are used for running a product or a business are shown in this index. It's a cost of developing or providing non-consumable parts of products or systems.
-
Other I/E:
It stands for Other Income or Expense, automatically calculated by Odoo for the variable add-ons to the product.