Sales Dashboard
Plug 'n' Play Dashboard to track and analyse sales data
Features
Pay Once
Free installation
Free 6 months support
Lifetime Access
Price is in US dollars and includes all taxes

Chat with our experts
Pre-requisites —
- Account analytical account
- Account analytical tag sale order line rel
- Account analytical tag
- Product category
- Product template
- Res partner
- Res partner category
- Res partner res partner category rel
- Sale Order
- Sale order line rel
- Stock picking
Comparison
Odoo sales sample report —
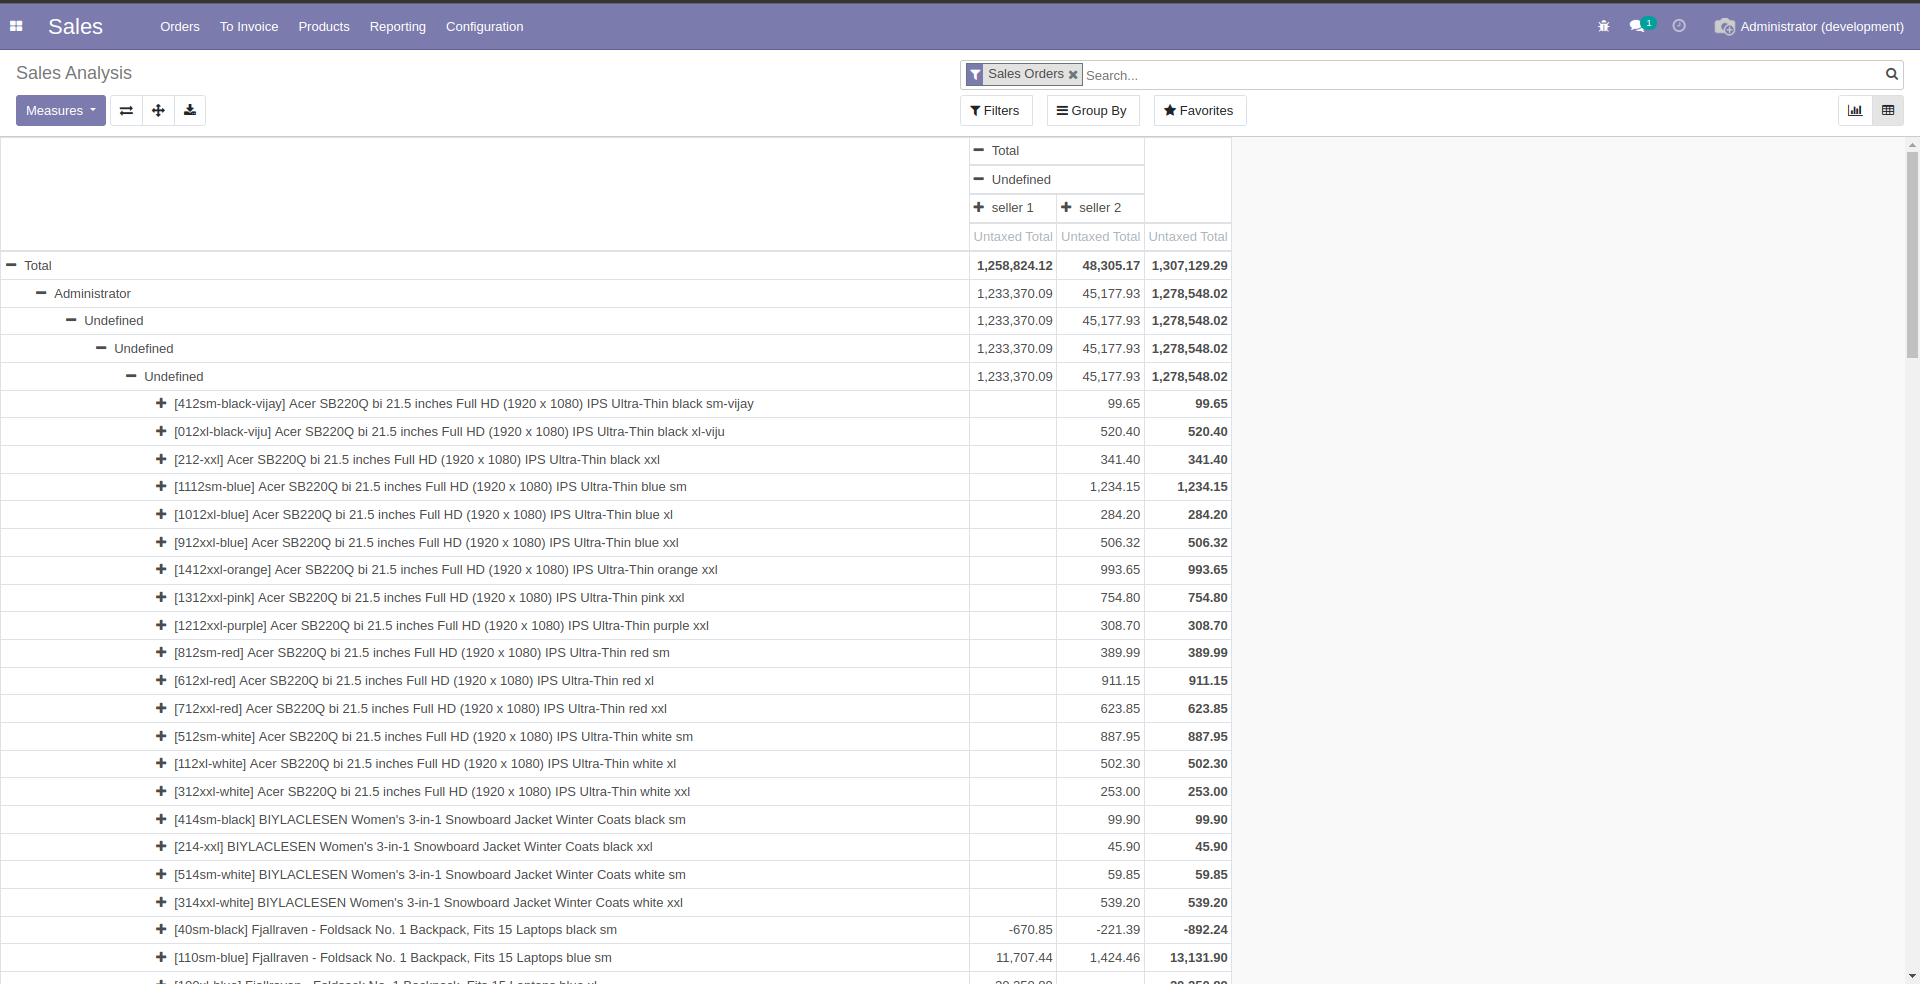
Live Preview
Overview
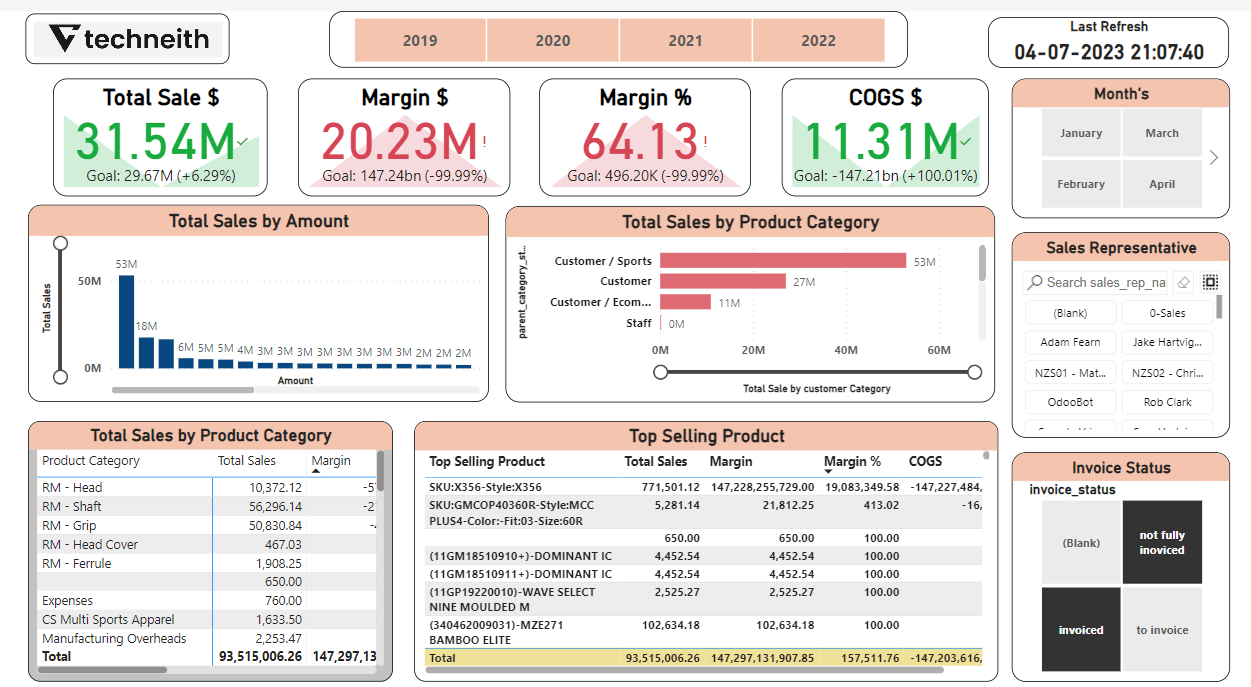 Dashboard
Tracking and analysing sales data is critical in today's highly competitive business world. Sales dashboards provide a quick and easy way for businesses to gain a comprehensive view of sales data, allowing them to make informed decisions that can drive growth and revenue. Techneith provides a sales dashboard with a variety of features designed to help businesses make the most of their sales data.
One of the most notable features of Techneith's sales dashboard is its ability to track the performance of sales representatives. Businesses can use this feature to track individual sales rep performance, allowing them to identify top performers and take steps to improve the performance of underperforming reps.
Sales representative performance analysis
The slicer available in Power BI helps you to select the sales representative thus helping you analyze the profits and sales delivered by the salesperson.
Customized dashboards
The organization's design and UI templates are reflected in the way our dashboard is made. This makes sure that using and navigating the dashboard is simple. Since we create dashboards from scratch, we can tailor them to the specific needs of the organization.
Real-Time Data
The dashboard can be refreshed in minutes, ensuring that the data displayed is accurate to the last detail. This enables businesses to make informed decisions based on real-time data.
Key KPIs Used in Sales Dashboards
 Slicers
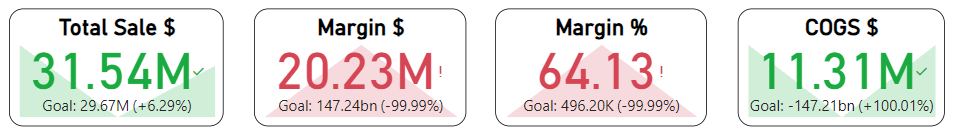 KPI's
KPI'sTotal Sales $
Total sales is a key performance indicator used by sales departments to track the total amount of revenue generated from sales over a given period. It's also referred to as total revenue and is a good measure of business health.
Margin $
Margin is the difference between revenue and the cost of goods sold (COGS). It represents the amount left over after accounting for the direct costs associated with producing or acquiring the products or services being sold.
Margin %
Margin is a financial ratio measuring the percentage of profit a company earns from its revenue. Expressed as a percentage, it indicates how much profit the company makes for every dollar of income generated.
COGS
Cost of goods sold (COGS) refers to the direct costs of producing the goods sold by a company. This amount includes the cost of the materials and labor directly used to create the good. It excludes indirect expenses, such as distribution costs and sales force costs.
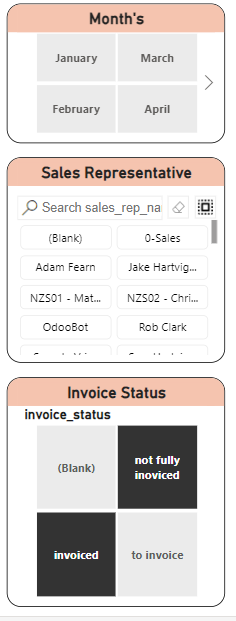
Slicers
Sale Representative Slicer
The sales Representative slicer allows you to track your Sales Representative's individual performance and the number of deals in their pipeline, forecasted revenue, and any other performance indicators your team uses.
Invoice Status
The Invoice Status field lets you know where your customer is in the invoice approval and payment process. The turnaround time for an invoice to move between statuses depends on your customer's internal processes.
Month and Year Slicer
This provides an interactive way to narrow down the data displayed in visualizations to a particular timeframe, making it easier to focus on specific periods of interest.
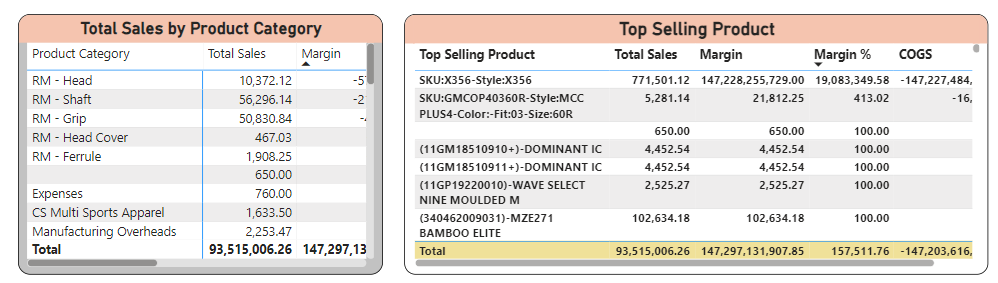 Top Selling Products
Delivered sales by month
This KPI highlights the number of products sold in a particular month and gives a monthly analysis with respect to the growth or decline of the products sold.
Ready to get started?
Get this sales dashboard for your Odoo data today.