
Budget Sales Dashboard
Plug 'n' Play Dashboard to make Sales and Budget understanding easier
Features
Combination of Budget and Sales
Customized Dashboards
Real-Time Data
Pay Once
1100
Power BI
Free installation
Free 6 months support
Lifetime Access
Must Have: Budget table in Odoo
Price is in US dollars and includes all taxes

Chat with our experts
Pre-requisites -
- Product Product
- Product template
- Product category
- Sale Order
- Sales order line
- Account move
- Account move line
- Sale order line invoice rel
- Res company
- Cross budget lines
- Account budget post
- Res company
Net Income
Net income is the amount of accounting profit a company has left over after paying off all its expenses..
COGS
Cost of goods sold (COGS) also known as 'cost of sales' is the cost of acquiring or manufacturing the products that a company sells during a period.
Budget Sales Dashboard

EBITDA
An indicator of a company's operating profitability, EBITDA (Earnings Before Interest, Taxes, Depreciation, and Amortization) measures earnings before deducting non-operating costs.
Live Preview
Overview
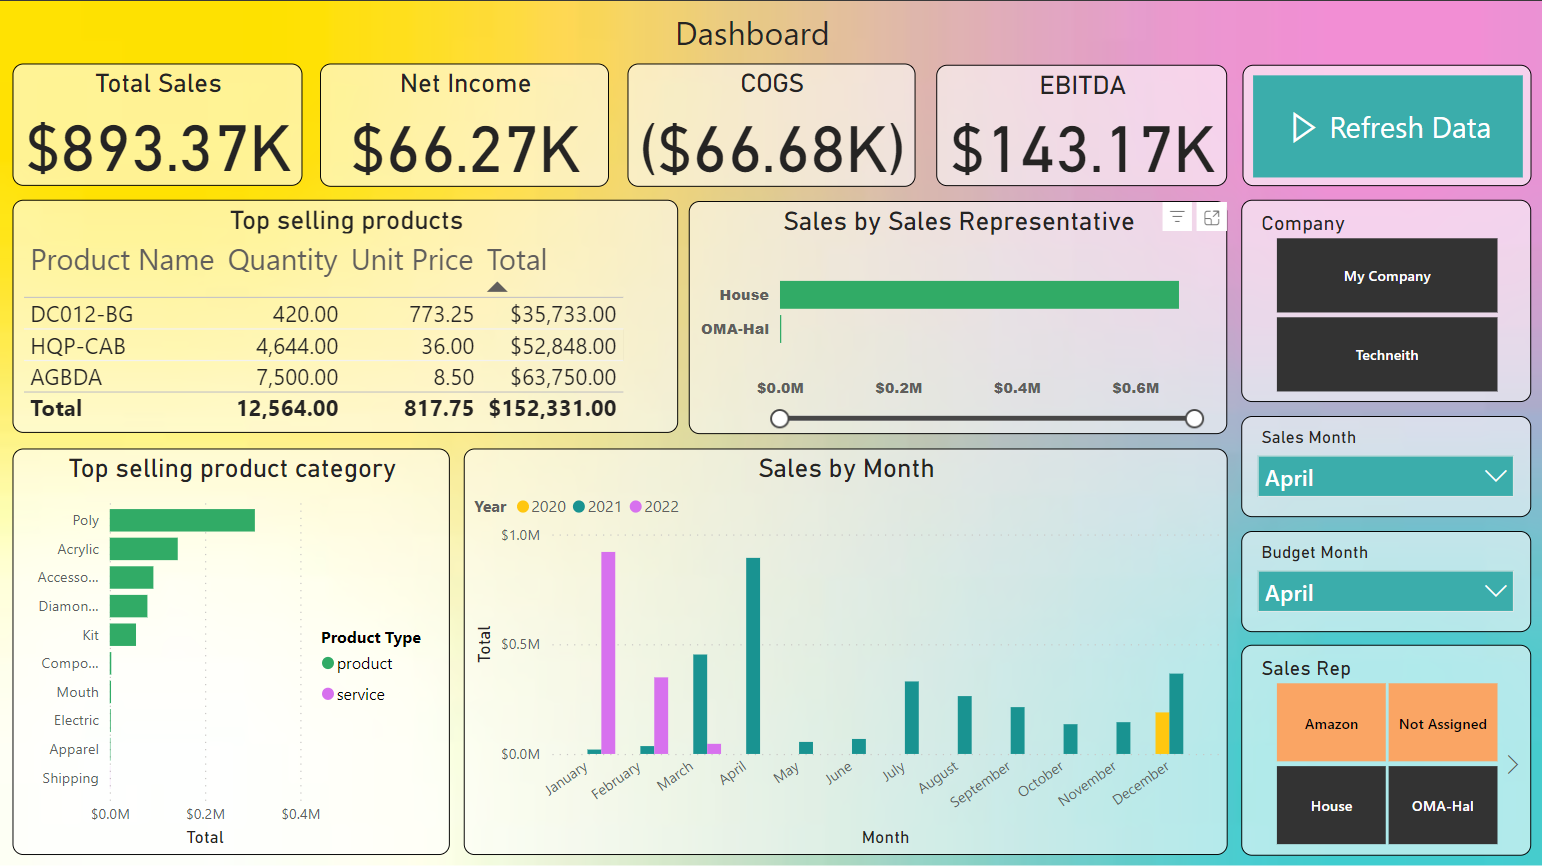
Budget and Sales Dashboard

This dashboard helps to understand your company's sales and budget figures on the basis of data available on odoo. It includes various key elements like Net Income, EBITDA, etc to understand the budgetary status of the company. features related to sales and products in the company play a crucial role in understanding the company's needs and in taking decisions accordingly.
Customized dashboards :-
The organization's design and UI templates are reflected in the way our dashboard is made. This makes sure that using and navigating the dashboard is simple. Since we create dashboards from scratch, we can tailor them to the specific needs of the organization.
Real-Time Data :-
The dashboard can be refreshed in a matter of minutes, ensuring that the data reflected is precise to the last detail. This allows organizations to make informed decisions based on real-time data.
Key KPIs Used in Budget Sales Dashboards

- Net Income :- Net income is the amount of accounting profit a company has left over after paying off all its expenses.
- COGS :- Cost of goods sold (COGS) also known as 'cost of sales' is the cost of acquiring or manufacturing the products that a company sells during a period.
- EBITDA :- EBITDA stands for earning before interest, tax, depreciation and amortization. As the name suggests it is a measure of a company's overall financial performance and is used as an alternative to the net income in some circumstances.
Slicers Used in Budget Sales Dashboards

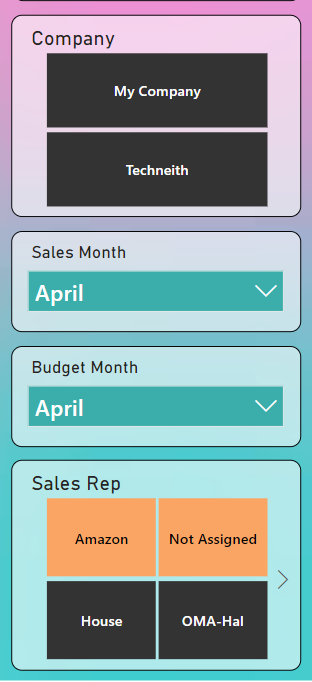
- Company :- This slicer will affect the whole dashboard and apply the filter of the company as selected. Multiple companies can be selected at a time.
- Sales Month :- This slicer will apply a month filter on total sales, top selling product, sales by sale representative and top selling product category. It will apply a filter of the month selected. Multiple selections are allowed.
- Budget Month :- This slicer will apply a month filter on Net Income, COGS and EBITDA and reflect these terms on the basis of month selected. The budget month is based on the date arrived from the budget module. Multiple selections are allowed.
- Sales Rep :- This slicer will affect the top selling product, sales by sale representative and top selling product category on the basis of the representative selected in the slicer. It allows selecting multiple representatives at a time.