Profit & Loss Dashboard
Plug 'n' Play — Profit and Loss Power BI dashboard for your Odoo
Features
Pay Once
Free installation
Free 6 months support
Lifetime Access
Price is in US dollars and includes all taxes

Chat with our experts
Pre-requisites —
- Account Account
- Account account type
- Account move
- Account move line
Comparison
Odoo Profit and Loss Report
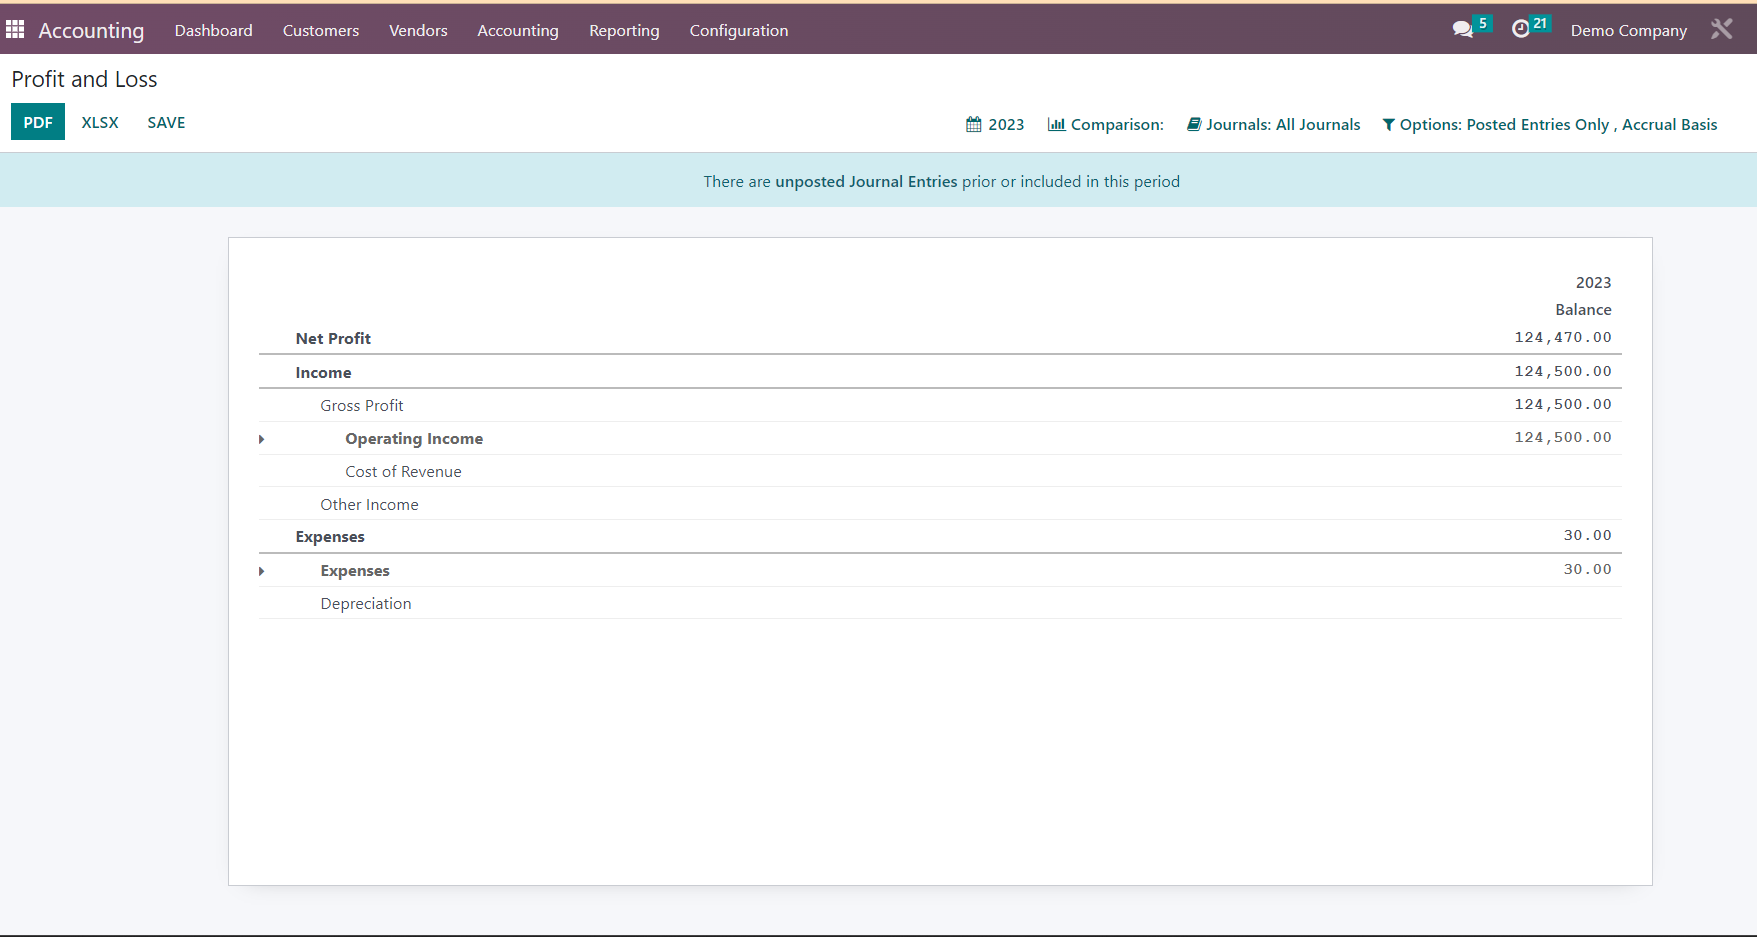
Profit and Loss Dashboard
Income
Income a company makes from selling products or services throughout a given time frame.
OPEX (Operating Expenses)
Routine costs associated with operating a firm, including rent, employee wages, and utility costs.
Profit and Loss Dashboard
EBITDA
An indicator of operating profitability, EBITDA measures earnings before deducting non-operating costs.
Gross Profit
A company's profit earned before deducting operational expenditures, the difference between revenue and cost of products sold.
Live Preview
Overview
DashboardBudgeting, accounting, and revenue forecasting are just a few of the complicated financial data that organizations must deal with as they expand. Profit and loss (P&L) is one of these and is a crucial aspect of every firm; it is important to analyze the factors that contribute to it. The P&L analysis process is made simpler for organizations using Techneith's Profit and Loss Dashboard for Odoo.
Our Profit and Loss Dashboard is made to assist companies in evaluating their financial performance and discovering areas that need improvement. Insights into the organization's financial data are provided by the dashboard in numerous significant ways.
Growing & Declining Products
The dashboard provides a detailed analysis of the sales performance of each product. This helps organizations to identify products that are performing well and those that are not.
Customized dashboards
The organization's design and UI templates are reflected in the way our dashboard is made. This makes sure that using and navigating the dashboard is simple. Since we create dashboards from scratch, we can tailor them to the specific needs of the organization.
Real-Time Data
The dashboard can be refreshed in a matter of minutes, ensuring that the data reflected is precise to the last detail. This allows organizations to make informed decisions based on real-time data.
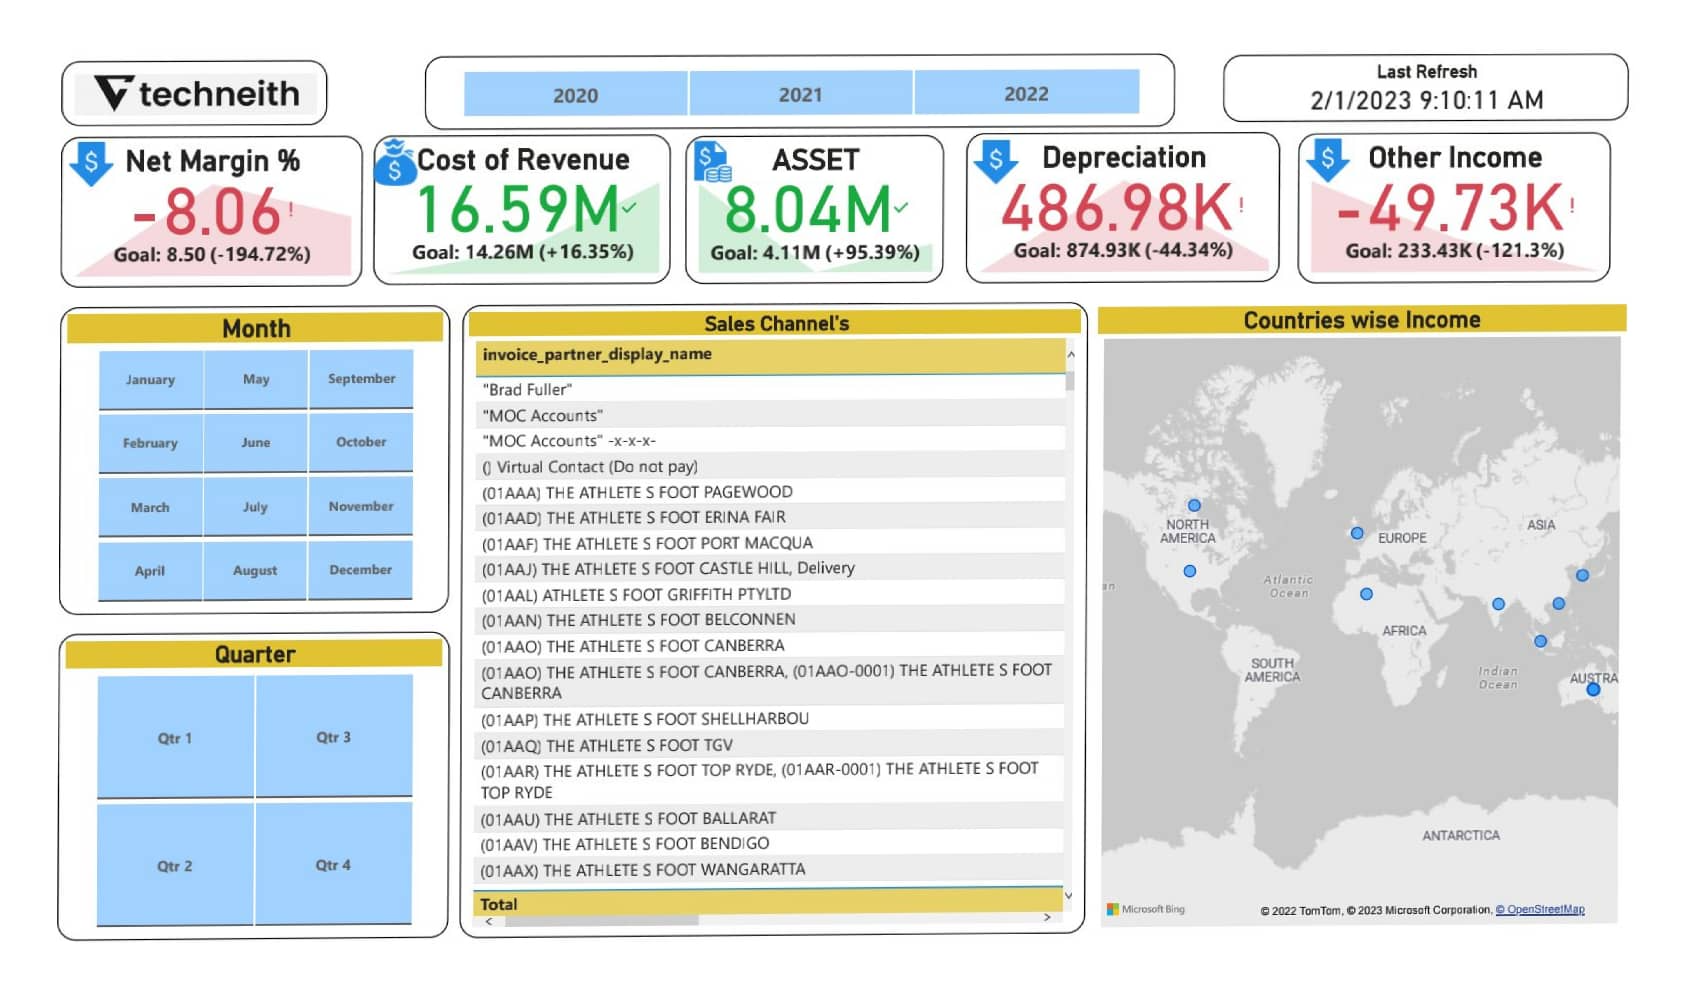
Key KPIs Used in Profit and Loss Dashboards
 KPI's
KPI's- Income — Income a company makes from selling products or services throughout a given time frame.
- OPEX (Operating Expenses) — Routine costs associated with operating a firm, including rent, employee wages, and utility costs.
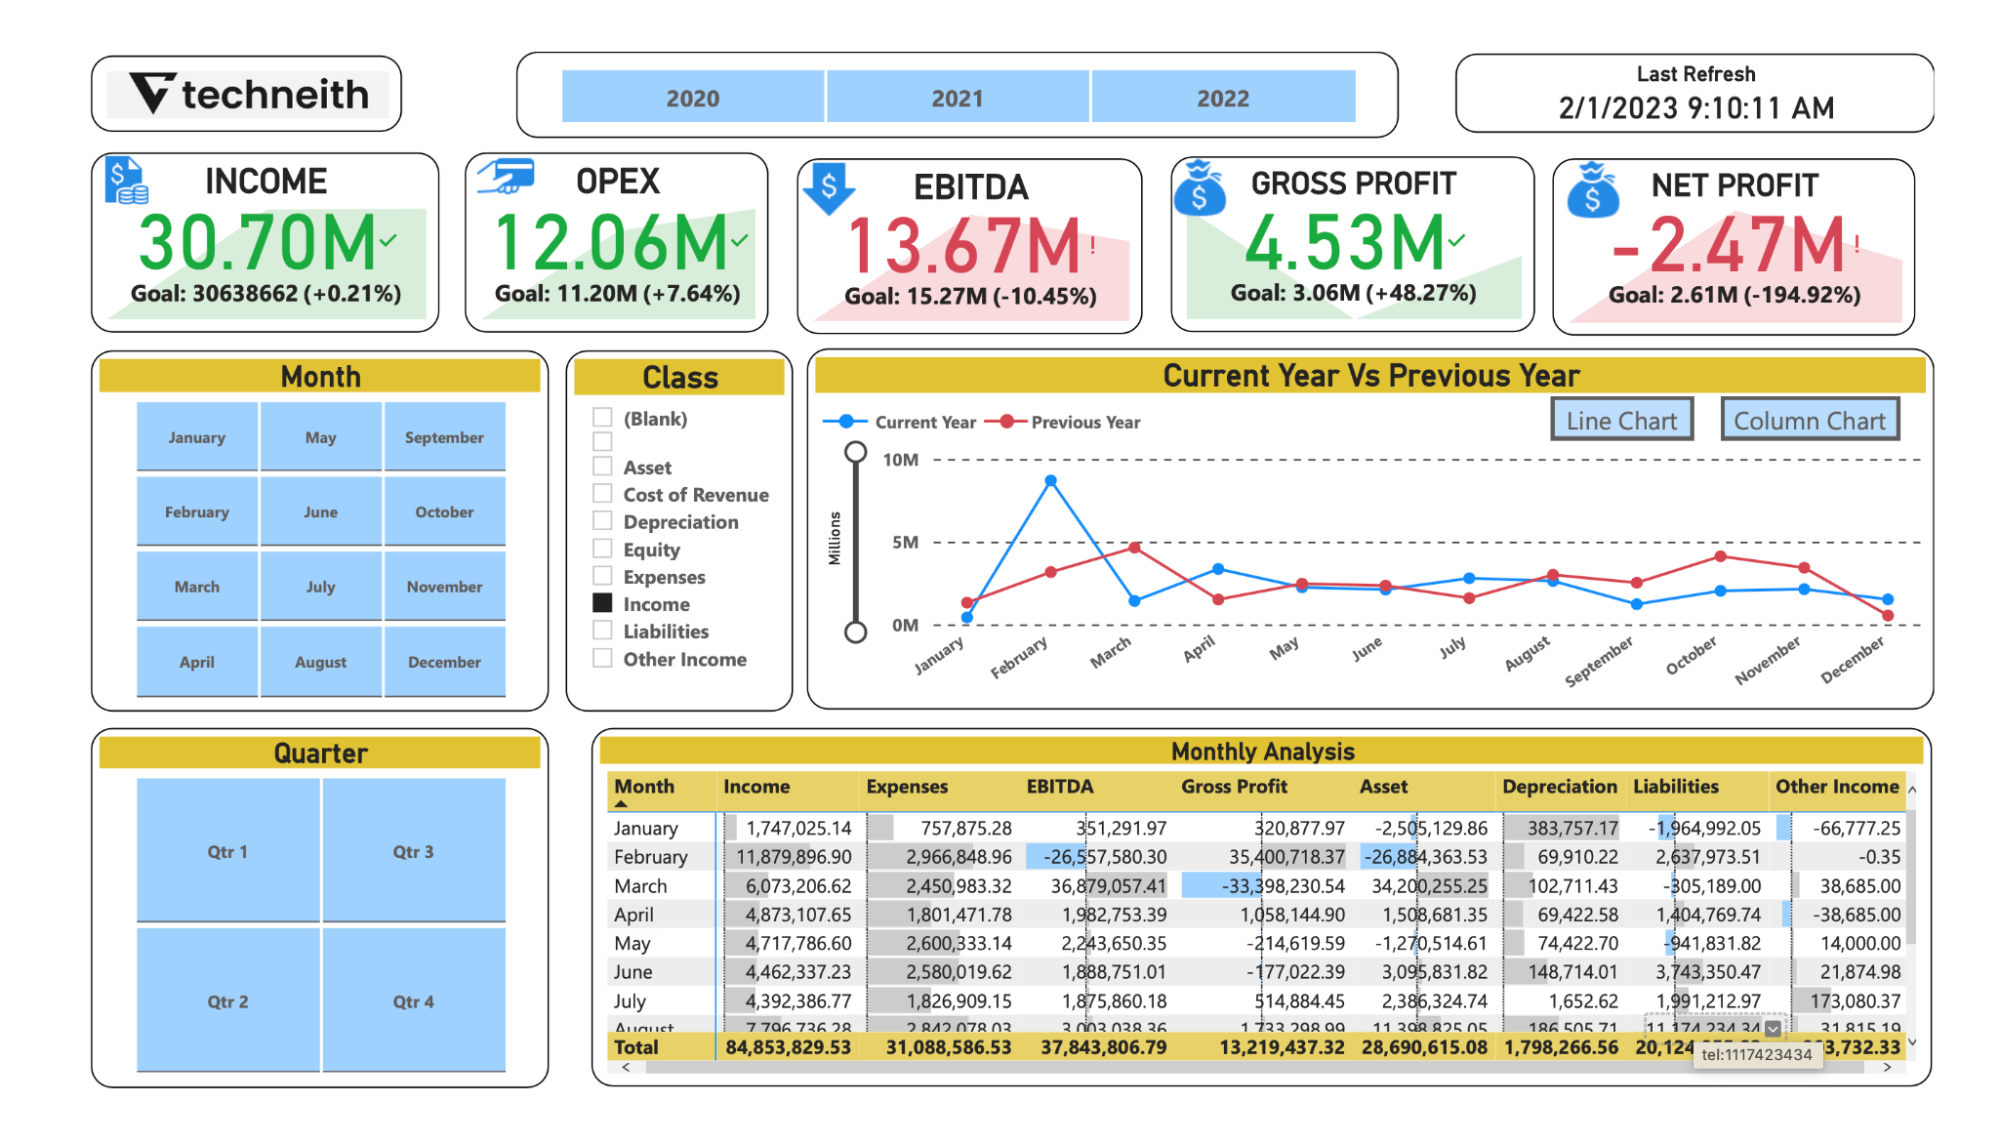
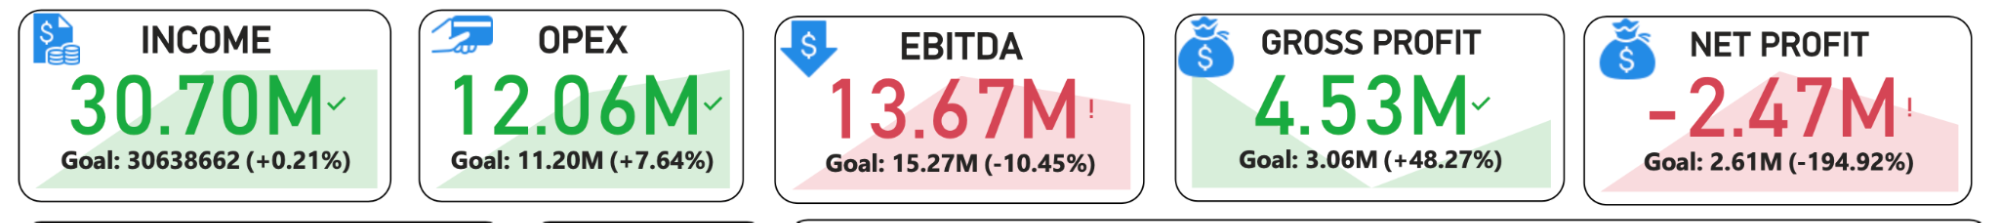
- EBITDA — An indicator of a company's operating profitability, EBITDA (Earnings Before Interest, Taxes, Depreciation, and Amortization) measures earnings before deducting non-operating costs.
- Gross Profit — A company's profit earned before deducting operational expenditures is known as gross profit, which is the difference between revenue and cost of products sold.
- NET Profit — The profit earned by a company after subtracting all expenses, including taxes and interest.
Ready to get started?
Get this Profit & Loss dashboard for your Odoo data today.